Thoughts on Science
the blog of Danelle Haake
the blog of Danelle Haake
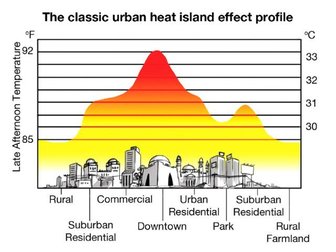 How urban areas are changing air temperatures. Source: Farhan Anwar / Design: Jamal Khurshid How urban areas are changing air temperatures. Source: Farhan Anwar / Design: Jamal Khurshid The lab I work in has been a very busy place for the past few weeks, especially for my lab-mate, Megan Pagliaro. She is studying how fish from streams and lakes respond to long-term increases in water temperatures. The expectation or hypothesis is that fish living in places where summer water temperature is warmer will be able to survive higher peak temperatures better than fish from places where where summer temperatures are more moderate. This is kind of like saying that someone from Oregon will be better suited to a Texas summer than someone from Alaska. Megan is using the existence of the urban heat island effect in St. Louis as the source of the temperature difference. Over the summer, Megan captured fish from sites in about 16 lakes and 14 streams. Each of these sites has also been home to a temperature logger that has recorded hourly temperatures. The expectation is that the lakes and streams that are closer to the city will generally be warmer than those that are farther from the city; factors like lake size and the presence of springs in some streams may influence the water temperature and mute the urban heat island effect. The data from the temperature loggers will help Megan place the sites on the heat island temperature gradient and relate the fish responses to the actual conditions in their home waters. So how does one go about testing the temperature tolerance of the fish? With a test of the Critical Thermal Maximum (or CTMax). I can share the basics of how Megan did it. First, she acclimated all of the fish to the same moderate temperature. Then she put some of them (11 or 12 at a time) in individual small containers in an aquarium so that all of the fish in the aquarium would experience the same rate of temperature change. Water was pumped through a heater and back into the aquarium to gradually increase the temperature. She would then watch the fish until they experienced a loss of equilibrium (this means that they couldn't stay right-side-up anymore). The temperature when each fish lost equilibrium is the CTMax for that fish. Megan then repeated the test on additional groups of fish. Each test took 2-3 hours, so this process went on for a couple of days. 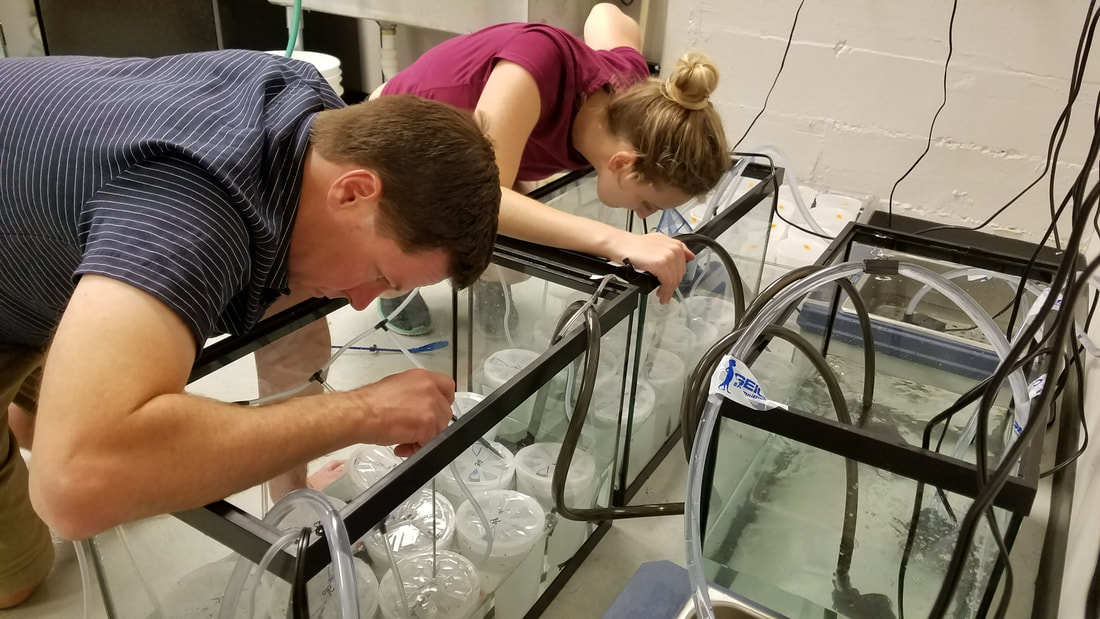 Megan and Jason watch the fish until they flip on their sides and cannot right themselves. Megan just collected the last of the dataloggers from the lakes last week and some of the ones in streams are still in the field. I hope to share her results in the future, so be sure to check back in the coming months!
0 Comments
Leave a Reply. |
AuthorDanelle Haake, Archives
March 2020
Categories
All
|
 RSS Feed
